“Data is our ultimate world interface”
| Accoto 2014 |
“In digital realism, a data-driven service instantiation is vectorialized by pre/mediation, im/mediacy, sub/mediality”
| Accoto 2014 |
“In digital realism, data agency is ontologically: 1) imbricated 2) entangled 3) coded 4) premediated”
| Accoto 2014 |
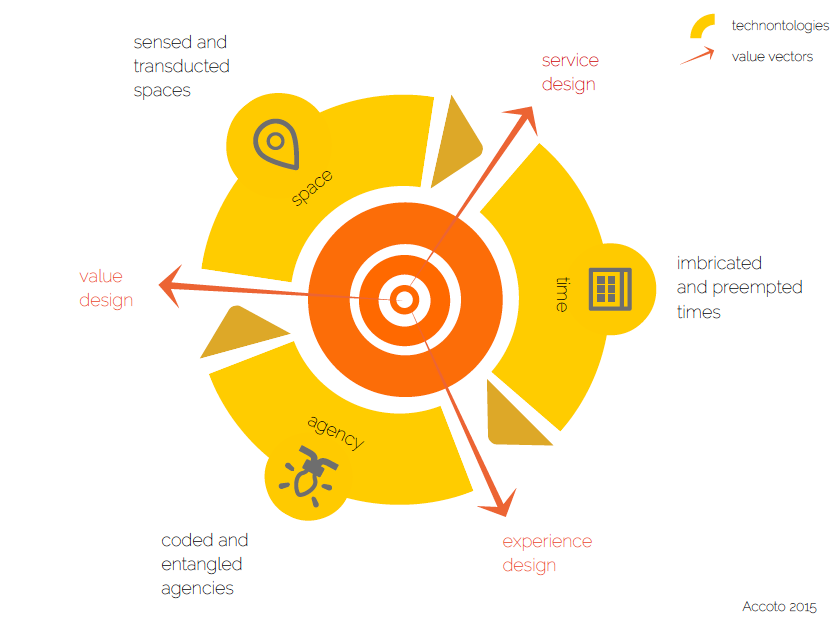
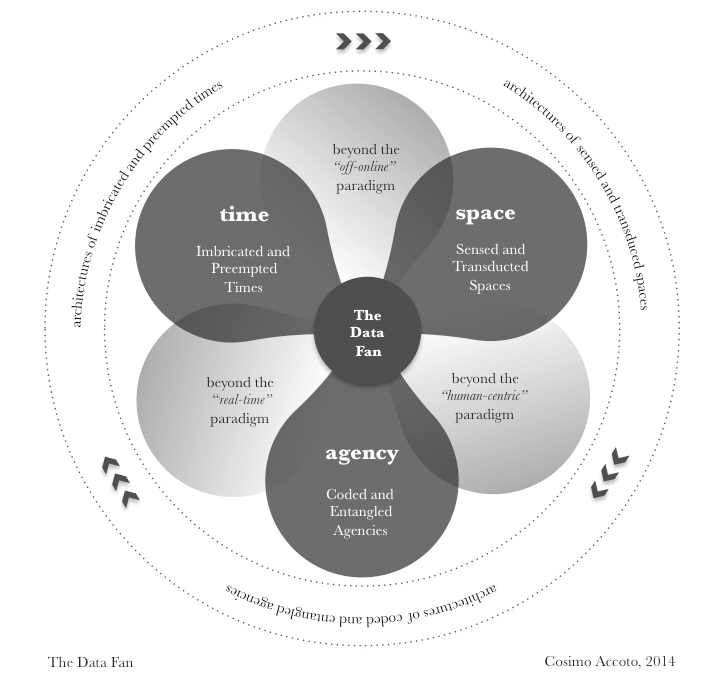
“Big Data is not about 3V’s (and its variants). It’s about space, time and agency: an ontology shift rather than a technology”
| Accoto 2014 |
“In a digital realism perspective, body and code tend to coincide. In the biotic interrupt, the act is indistinguishable from the abstr/act”
| Accoto 2014 |
“Premediative or anticipatory regimes instantiate and operationalize customer data enacting customer horizons”
| Accoto 2014 |
“Quantified Self is not just about lifelogging, but it’s more about lifehacking. Self-hacking is a new self-governing practice”
| Accoto 2014 |
“To be mediated by the immediacy, with N=all (totality) and T=-1 (premediation), is the service instantiation in a data-intensive age”
| Accoto 2014 |
“Quantified selves (Ostherr 2013), social machines (Semmelhack 2013), ambient commons (McCullough 2013) are data actants”
| Accoto 2014 |
“Data Ontologies: Totality, Immediacy, Premediation are the ontological vectors reshaping businesses and organizations”
| Accoto 2014 |
“In a data deictic perspective, a quantified, networked and anticipated self is emerging as new marketing platform”
| Accoto 2014 |
“Data deixis changes the logic of the customer segmentation. It’s no longer a logic of set, rather a logic of emergence”
| Accoto 2014 |
“In data-intensive age, customer centricity is useless unless you include the algorithmic mediation of secondary agency”
| Accoto 2014 |
“The ‘data continuum’ paradigm is reshaping customer information markets and systems as well as industry boundaries”
| Accoto 2014 |
“Looking at data as new personal and partecipatory markets devices is a way to deeply understand our data-intensive age”
| Accoto 2014 |
“In a data-intensive age, “real-time” is an ontological continuum spanning from subperceptuality to embedded temporalities”
| Accoto 2014 |
“Market, marketing or marke-things intelligence? In an ubiquitous data age, the situated analytics performs operations
| Accoto 2014 |
“Technologies for markets remote sensing are not monitoring practices, but modeling devices for new value propositions”
| Accoto 2014 |
“Big Data is about Transduction of Coded Spaces, Subperceptuality of Emebedded Temporalities and Machinic Secondary Agencies”
| Accoto 2014 |
“In a subperceptual regime of temporality, the im-mediate is ontologically and conceptually linked to the un-mediated”
| Accoto 2014 |
“In digital age, we have performances not contents, performers not users, performables not channels”
| Accoto 2014 |
“In a data-intensive age, customer centricity is useless unless you include the algorithmic mediation of secondary agency”
| Accoto 2014 |