
Author: Cosimo Accoto
Research Affiliate at MIT | Author "Il Mondo Ex Machina" (Egea) | Philosopher-in-Residence | Business Innovation Advisor | www.cosimoaccoto.com
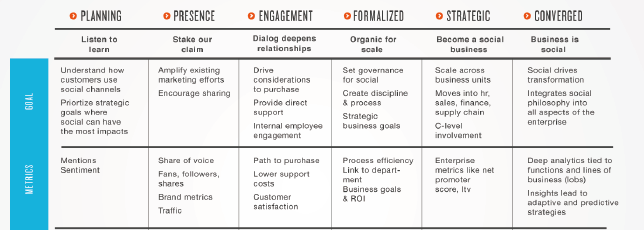
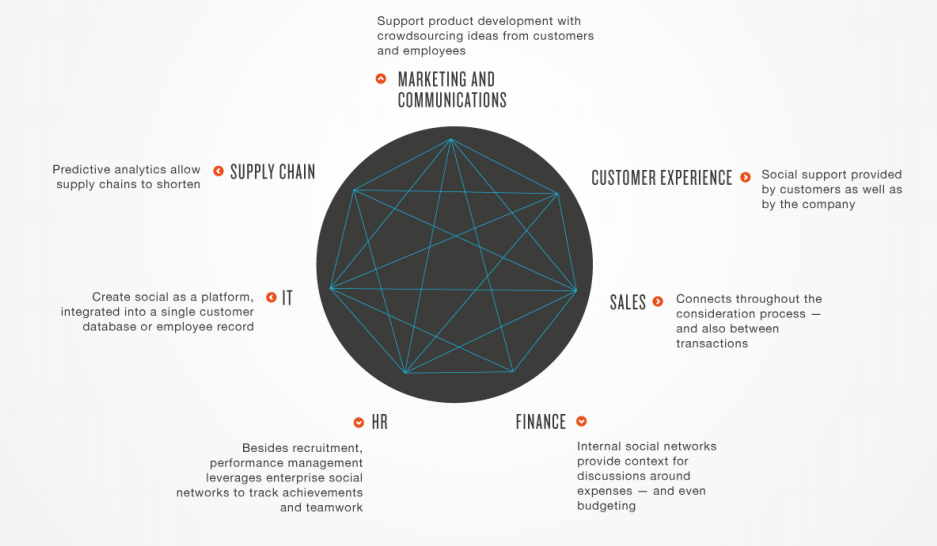
The evolution of social business [a new report by Altimeter Group]
http://www.altimetergroup.com/research/reports/evolution-social-business
[Altimeter Group, image and abstract] “Companies are not created equal. Altimeter Group found that companies go through six distinct stages of social business maturity, each with unique risks and opportunities.Based on a series of interviews with organizations that are investing in social media strategies at varying levels, we learned that notable differences exist between companies implementing a social media strategy and those that are building a social business. A social media strategy lays out the channels, platforms, and tactics to support publishing, listening, and engagement. A social business strategy is the integration of social technologies and processes into business values, processes, and practices to build relationships and spark conversations inside and outside the organization, creating value and optimizing impact for customers and the business alike” (from the executive summary, Altimeter Group, 2013)
[forthcoming] social machines: how to develop connected products
[From the abstract] Your machines know things about you, and they have some things to say.
Our online interactions have formed the backbone of companies like Facebook and Twitter and have redefined social interaction. But what if machines like cars, bikes, health monitors, appliances, ATMs, and kiosks could all become members of your social network, and give you important information about what’s happening in your car, your home, and your body? Businesses like Ford, Proctor and Gamble, and dozens of startups are now using social machines to reach new markets, improve brand and market awareness, and increase revenues. Social Machines teaches the benefits and the process of connecting machines to a social network.
* Articulates how “social” is a compelling new business model for the Internet of Things
* Discusses current technologies, such as smart phones and tablets, and how they can/will enable Social Machines
* Teaches how to learn from existing implementations and customize them for their own use
Who says only humans can be social? The next stage of interaction between people and their environment is upon us.
Relationship investment: buyer and seller
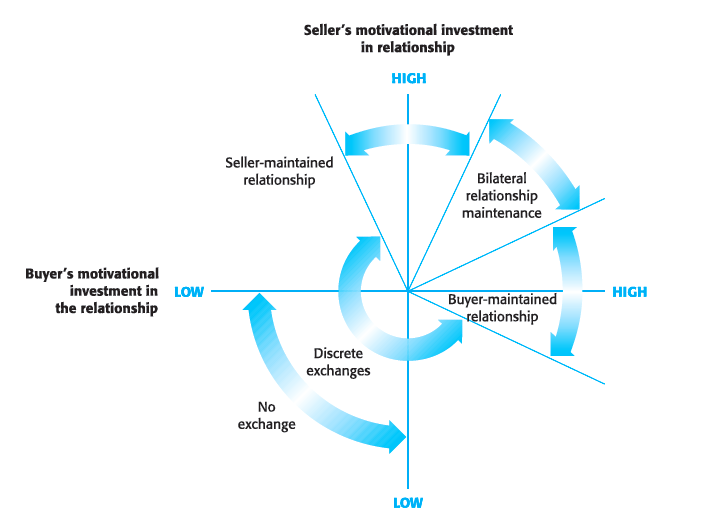
Image from Egan, “Relationship Marketing” (p.53, source: adapted from Dwyer et al., 1987, p. 14)
Dwyer et al. (1987, p. 14) suggest that the type of relationship that develops between a supplier and a customer is determined by the different amounts of motivational investment that buyers and sellers are prepared to commit to the relationship. They hypothesise that there are four types of active relationships in addition to ‘no exchange’ (Egan, p. 53)
Social Data in the IAB perspective

Social Data in the IAB perspective (image from the IAB document, Social Data Demystification and Best Practice, January 2013)
Social Business Intelligence beyond reporting and charting

“A data-driven company needs to move beyond reports and dashboards and into actionable granular system alerts that do not require interpretation and are small enough in scope to complete today. Think of your applications and systems as really smart people to follow, people who can post/tweet conditions that are based on real-time analytics, complex and deep dives into data that require multiple reports and complex interpretation. The simple statement “At the current rate of movement, three stores are out of stock of XYZ in one week, and the distribution center has no stock” can be posted and followed by any number of people: sales, manufacturing, management, warehousing, etc. That is actionable data that can be discussed, commented on, liked, shared, forwarded, and resolved within that E2.0 tool” (by Morgan, The Collaborative Organization, 2012, p. 98)
Toward an integrated “business networks sentiment analysis” #bigdata

In a social business environment, it’s relevant to measure not just the customer’s sentiment, but also the “sentiment” of all the “value exchangers” in the business networks and ecosystems. Correctly Sandy Carter (in her interesting “Get Bold”, 2012) points out the relevance of measuring both the sentiment of “social customers” and the “social employees” (as well as the sentiment of all the actors involved in the business ecosystem). And of course, in the social business perspective, not only the quantification of “sentiment”, but also the analytics of a wide range of additional social business measures.
Big science and collaboration (Boisot et alii, 2012, Collision and Collaboration)
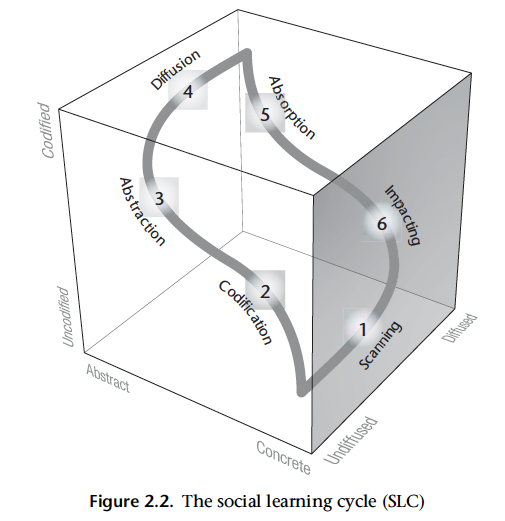
“This cyclical process of knowledge generation, articulation, generalization, dissemination, internalization, and application traces out a “social learning cycle” or SLC. As indicated in Figure 2.2, it consists of six phases, which are further elaborated in Table 2.1. An SLC is an emergent outcome of the data-processing and transmission activities of agents interacting within and across groups of different sizes. To the extent that individual agents can each belong to several groups, each locatable in its own I-Space, they will participate in several SLCs that interact to form eddies and currents. As one aggregates different groups into larger diffusion populations, however, their respective SLCs merge to create a slow flowing river. Figure 2.3 suggests that SLCs come in different shapes and sizes that reflect how extensively a given group invests in its learning processes and in which specific phases of the SLC its investments are concentrated” (Boisot et alii, Collision and Collaboration, 2012)
#bigdata concept/info timeline [my working progress]
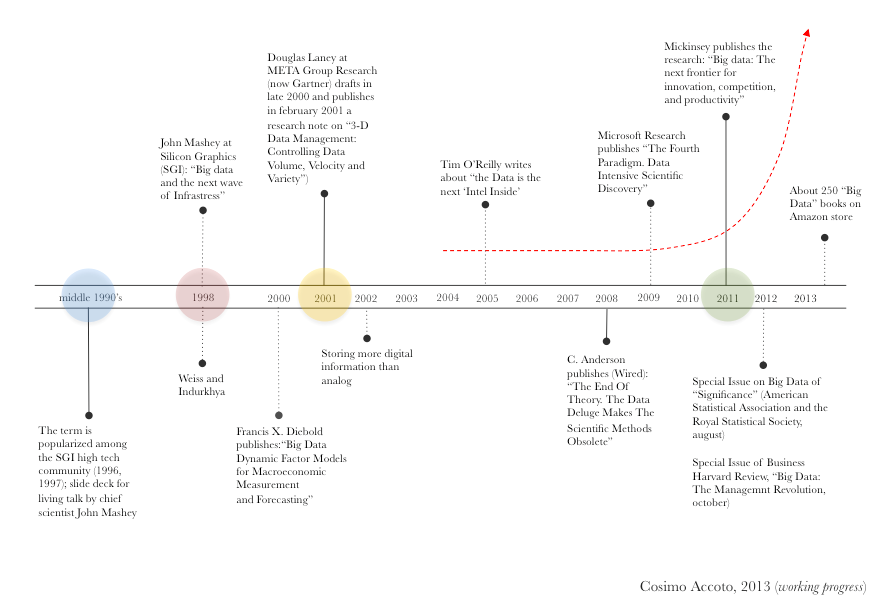
Resources for the timeline:
“The Origins of ‘Big Data’ : An Etymological Detective Story” By Steve Lohr (The New York Times, 2013)
“On the Origin(s) and Development of the Term “Big Data””, Francis X. Diebold (2012) University of Pennsylvania
Google Trend (2013) for the red line (search for “big data”)
Other resourses
